GMT -J オプション †
- GMT -J オプション
- はじめに
- projection指定子の大文字・小文字の違い
- projection, 各図法の記述例
- -JM, Mercator, メルカトル図法
- -JB, Albers conic equal area projection
- -JU, UTM, ユニバーサル横メルカトル図法
- -JC, Cylindrical projection, 円筒図法
- -JA, Lambert Azimuthal projection, ランベルト正積方位図法
- -JG, Azimuthal orthographic projection, 正射図法
- -JX, Non-geographical projection (linear)
- -JXl, Non-geographical projection (log-log, semilog), 両対数,片対数図
- -JX,-JZ, Non-geographical projection (3-dimensional)
- -JX, -Rd or -Rg, 地球全体図
- -JKf, -JKs, Eckert projection, エケルト図法
はじめに †
共通オプション -J は projection を指し,描画をするコマンドには必須のオプション.
図の種類,形状,スケールがこのオプションによって決定される.
J の次に必ずアルファベット1〜2文字が入り,描く図法の種類を表している.
projection指定子の大文字・小文字の違い †
J に続く英字で描く図法が決まるが,その英字が大文字か小文字かで,スケールの決定方法が異なる.
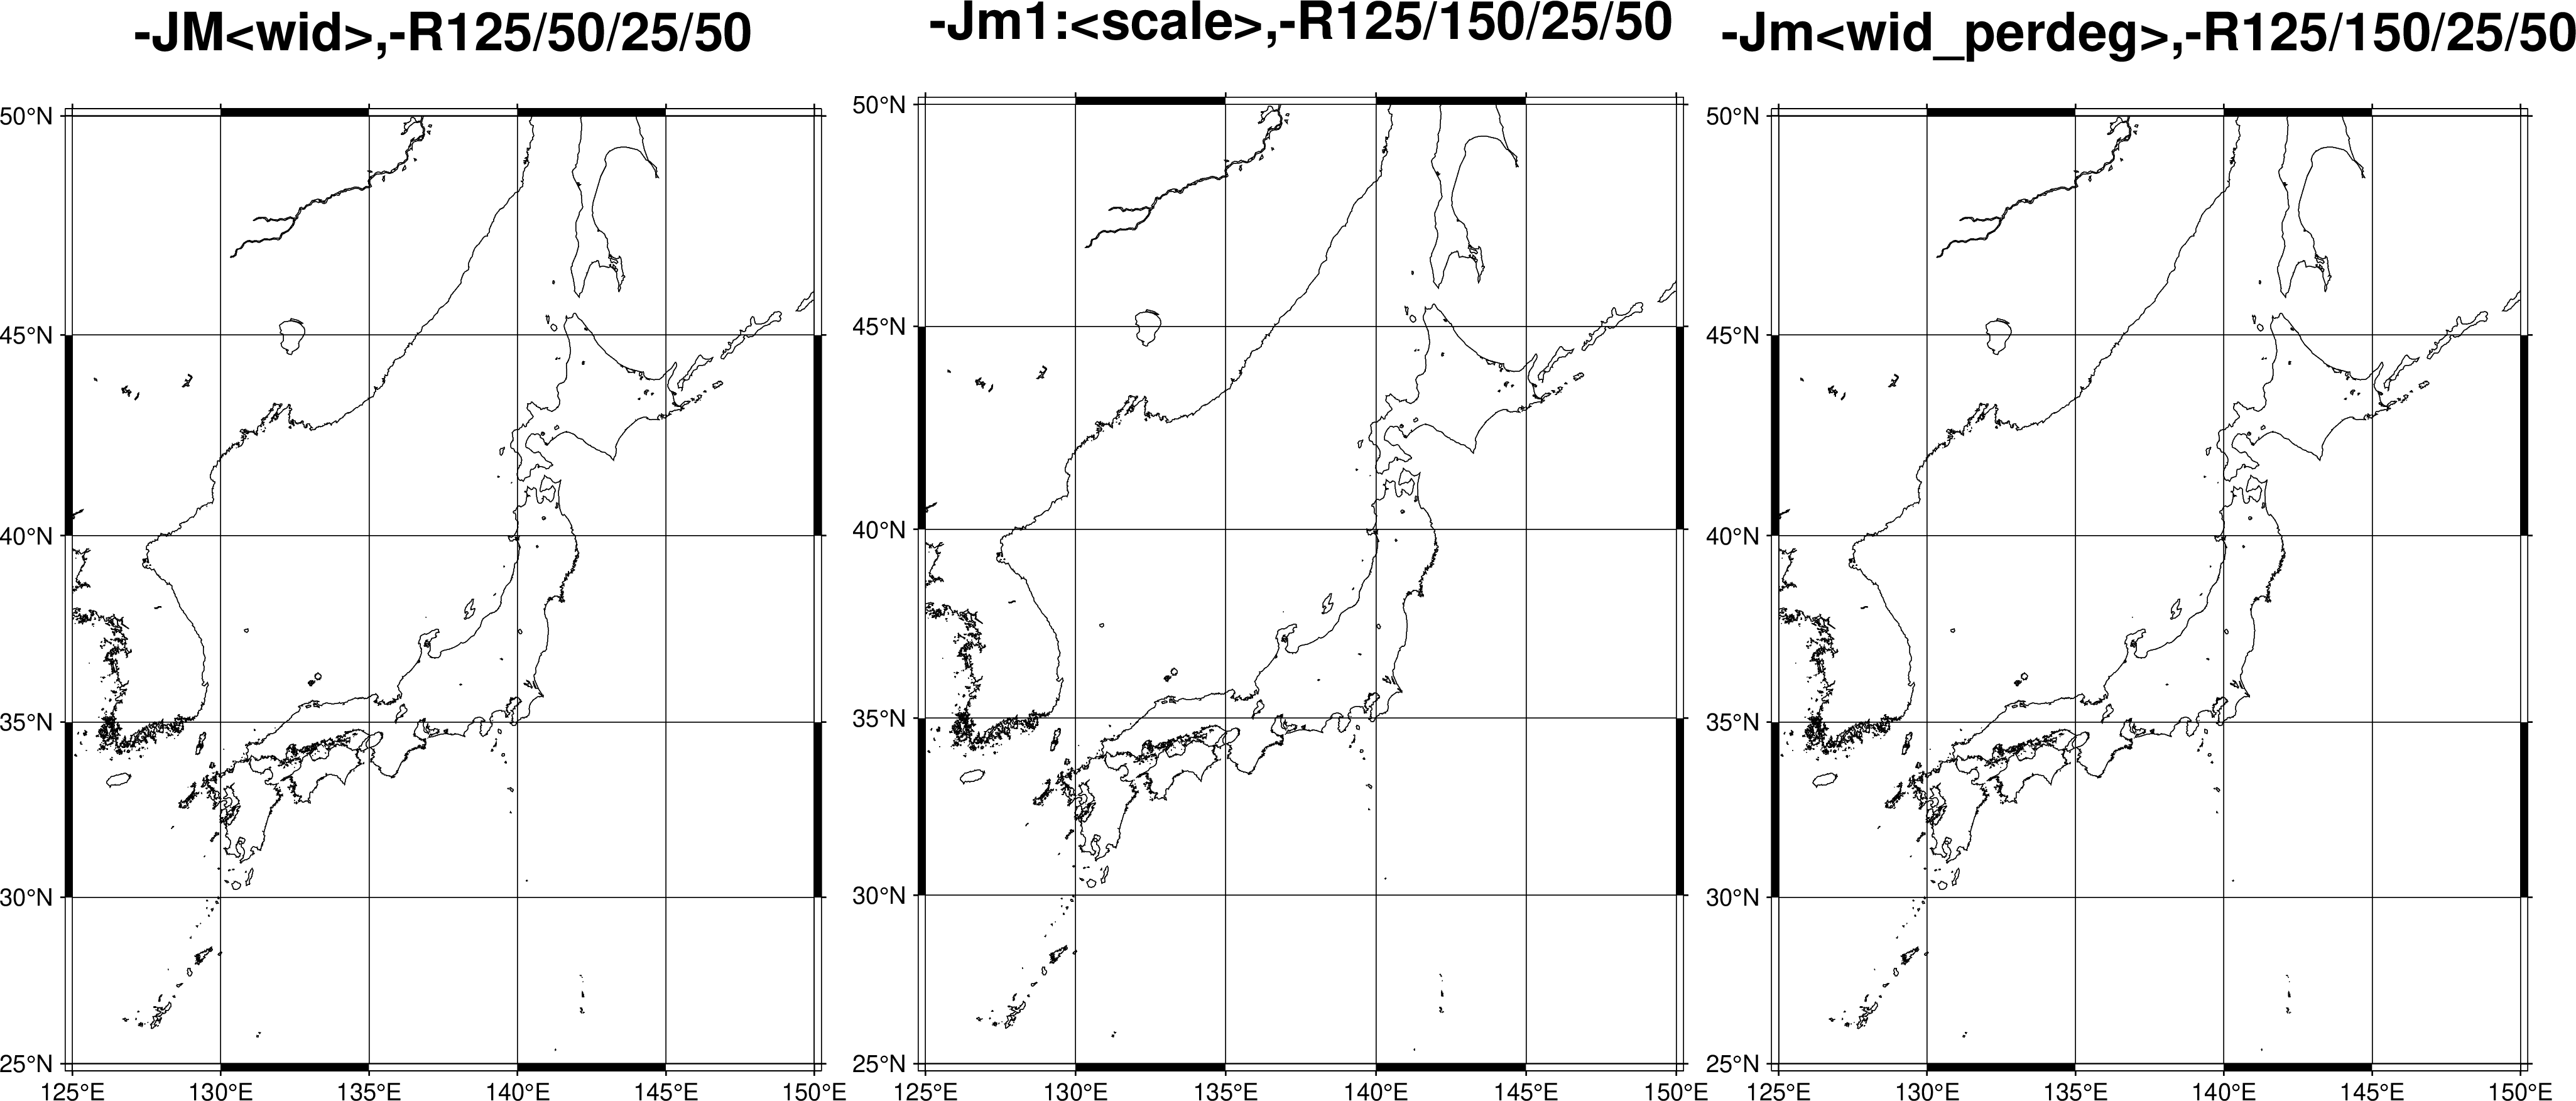
メルカトル図法を例にすると,おおよそ下記のような書き方がある.
- -JM<width>
- -Jm1:<scale>
- -Jm</degree>
ここで,<width> は出力する図の幅,<scale> は比,</degree> は1度あたりの幅を示す.
大文字 M は <width> インチなどの出力サイズを指定する方法,
小文字 m は実スケールとの比を指定する(出力される紙面にとっては相対的な)方法である.
この原則は -J オプションのその他(メルカトル図法を表す M, m 以外)も同様である.
それぞれの使用例と出力結果は下記の通り.
このページ3つの画像の表示サイズを統一しているが,実際の出力サイズは若干異なる.
#!/bin/bash
# filename
output="JMm"

proj1=M10
region1=125/150/25/50
axes1="-Ba5f5g5 -B+t-JM<wid>,-R125/50/25/50"

proj2=m1:2.75e7
region2=125/150/25/50
axes2="-Ba5f5g5 -B+t-Jm1:<scale>,-R125/150/25/50"

proj3=m0.4
region3=125/150/25/50
axes3="-Ba5f5g5 -B+t-Jm<wid_perdeg>,-R125/150/25/50"

# gmt6
gmt begin $output png
    gmt coast -J$proj1 -R$region1 $axes1 -W
    gmt coast -J$proj2 -R$region2 $axes2 -W -X11.5
    gmt coast -J$proj3 -R$region3 $axes3 -W -X11.5
gmt end
projection, 各図法の記述例 †
以降では,projection ごとに pscoast または psbasemap を用いてそれぞれ描いてみる.
描ける図法の種類が多いので,一部に限定する.
また,煩雑さを避けるため大文字,-J<uppercase> で統一し,小文字の-J<lowercase> の標記はしない.
図法によってオプション -R や -B も変更する必要があるが,ここではなるべく -J に着目し,他のオプション説明は最低限とした.
-JM, Mercator, メルカトル図法 †
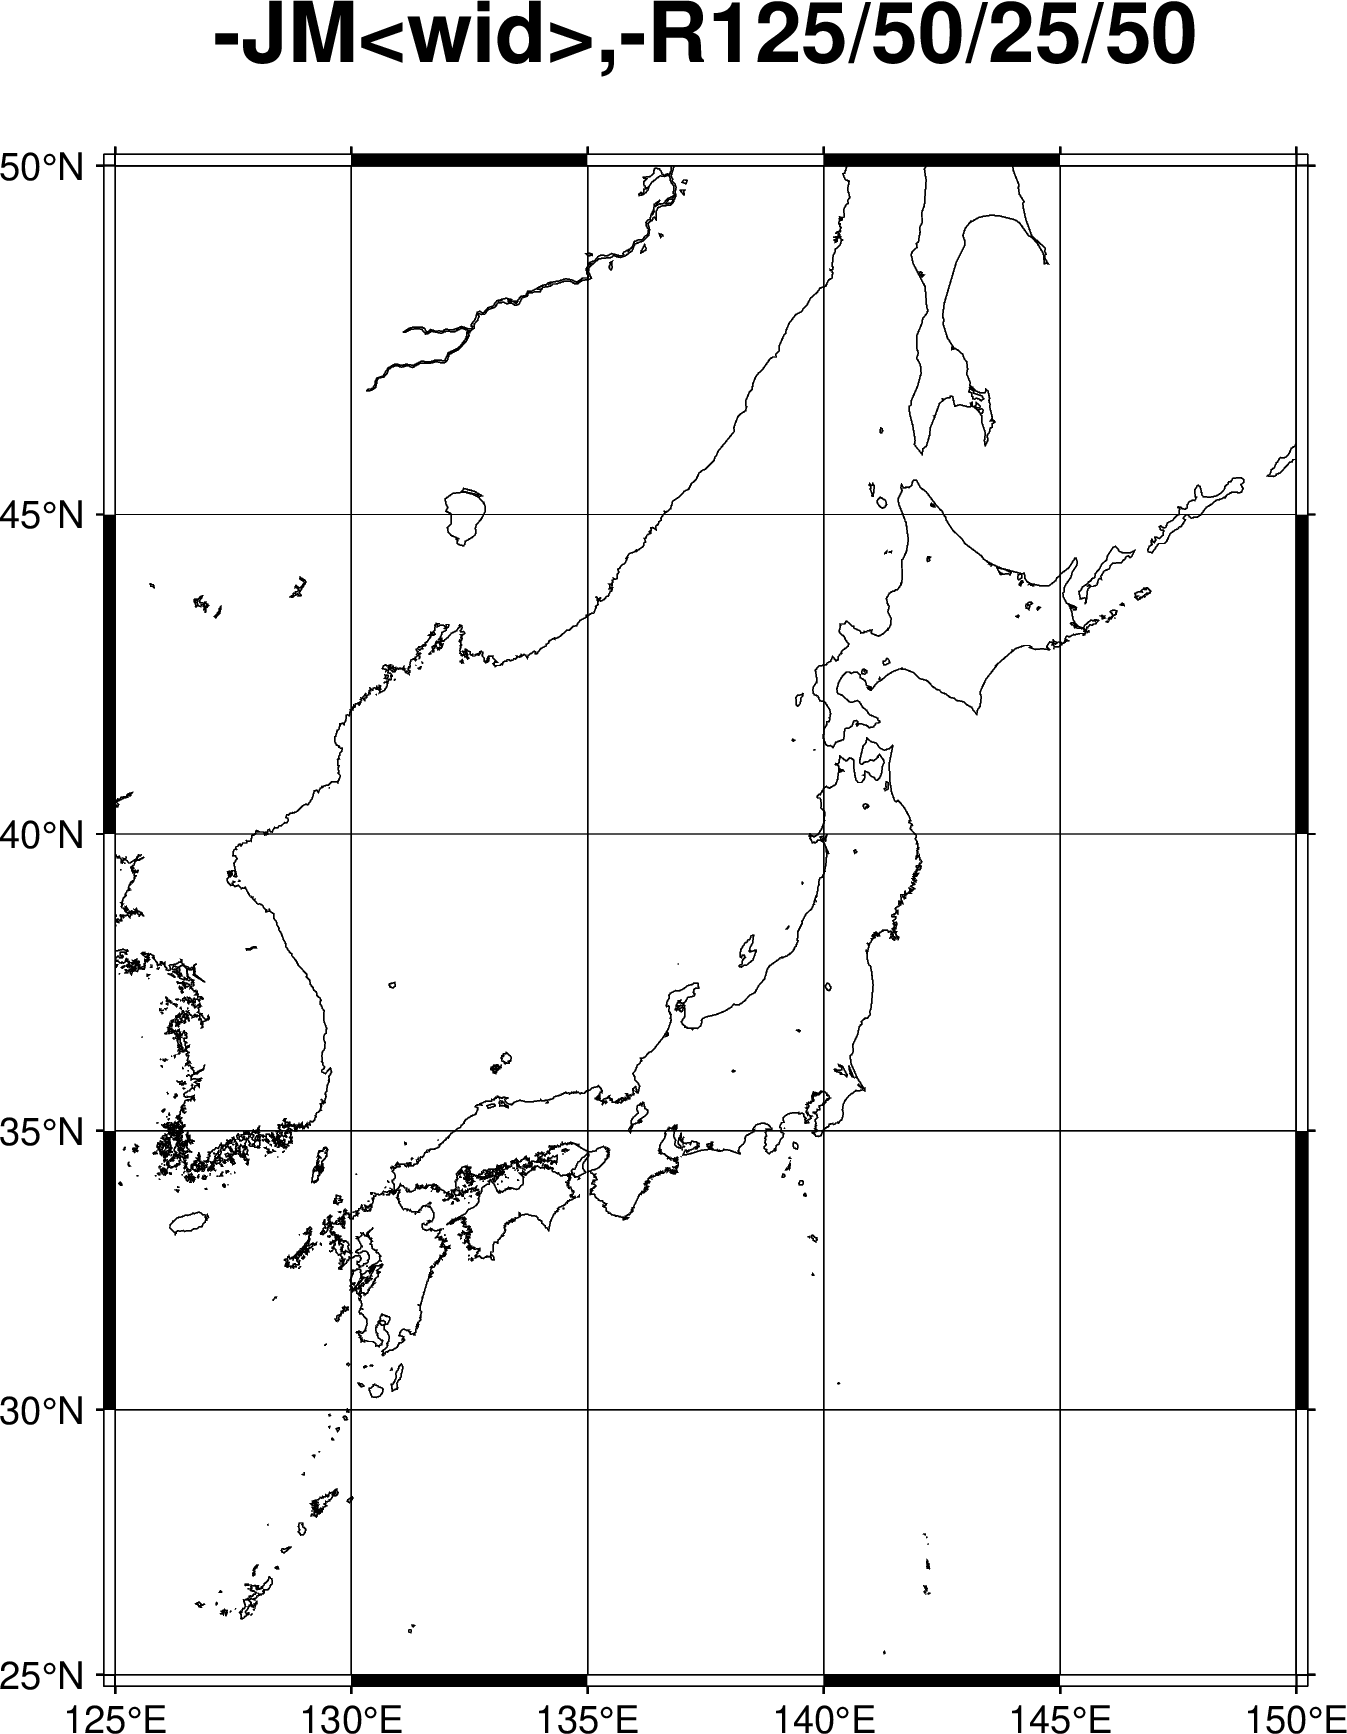
見慣れたメルカトル図法.記法は下記の通り.
- -JM<width>
- -JM<lon0>/<width>
- -JM<lon0>/<lat0>/<width>
# filename
output="JM"

proj=M10
region=125/150/25/50
axes="-Ba5f5g5 -B+t-JM<wid>,-R125/50/25/50"

# gmt6
gmt begin $output png
    gmt coast -J$proj -R$region $axes -W
gmt end

# gmt5
gmt pscoast -J$proj -R$region $axes -W -P > "${output}_gmt5.ps"
gmt psconvert -Tg -A "${output}_gmt5.ps"
-JB, Albers conic equal area projection †
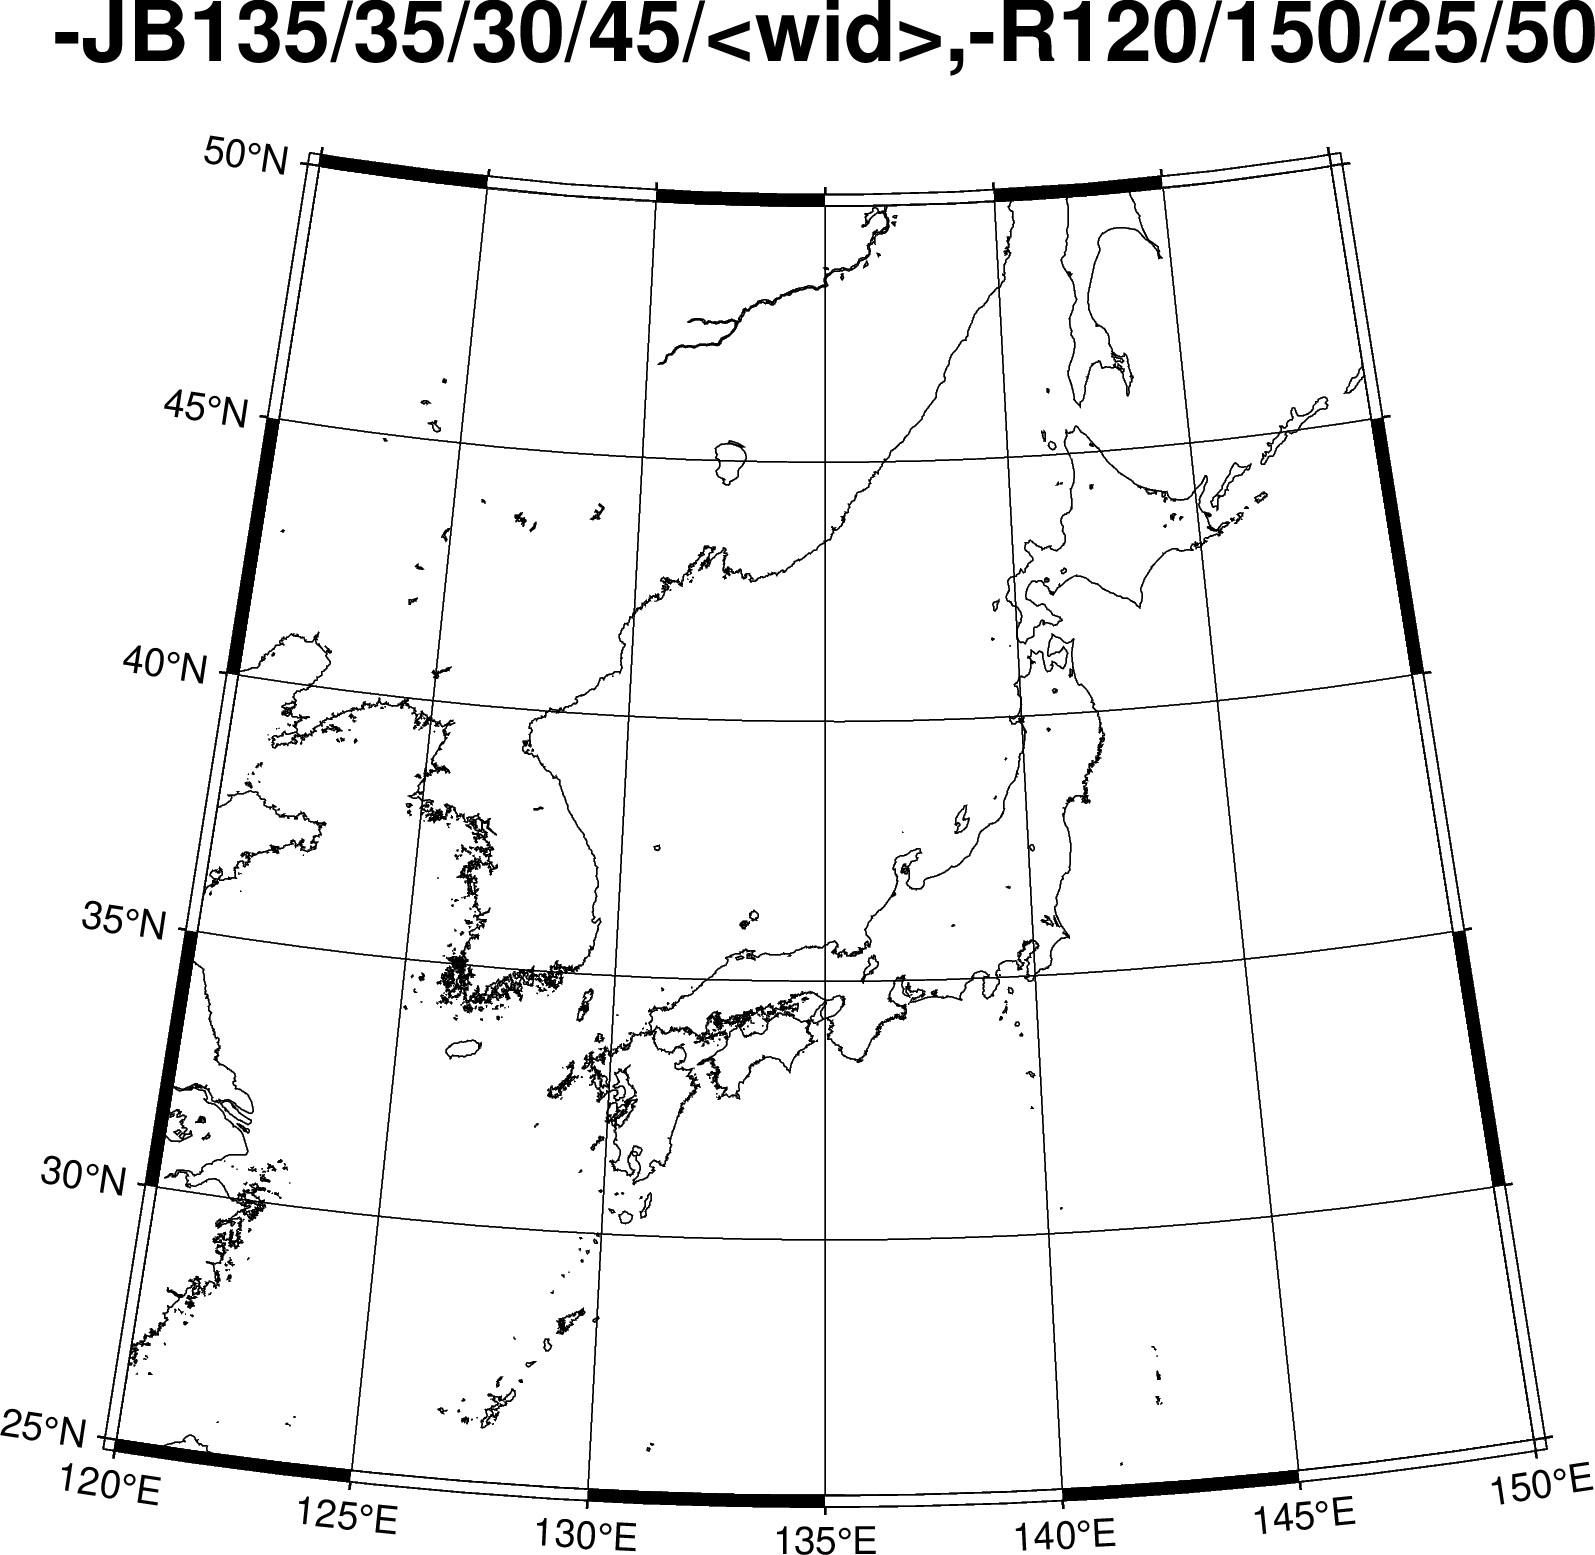
Conic projection の一つ.
- -JB<lon0>/<lat0>/<lat1>/<lat2>/<width>
ここで,<lat1>,<lat2> は Alberts projection の two standard pallalels に相当する.
参考: Wikipedia
# output file
output="JB"
# options
proj=B135/35/30/45/12
region=120/150/25/50
axes="-Ba5f5g5 -B+t-JB135/35/30/45/<wid>,-R120/150/25/50"

# gmt6
gmt begin $output png
    gmt coast -J$proj -R$region $axes -W
gmt end

# gmt5
gmt pscoast -J$proj -R$region $axes -W -P -V > "${output}_gmt5.ps"
gmt psconvert -Tg -A "${output}_gmt5.ps"
-JU, UTM, ユニバーサル横メルカトル図法 †
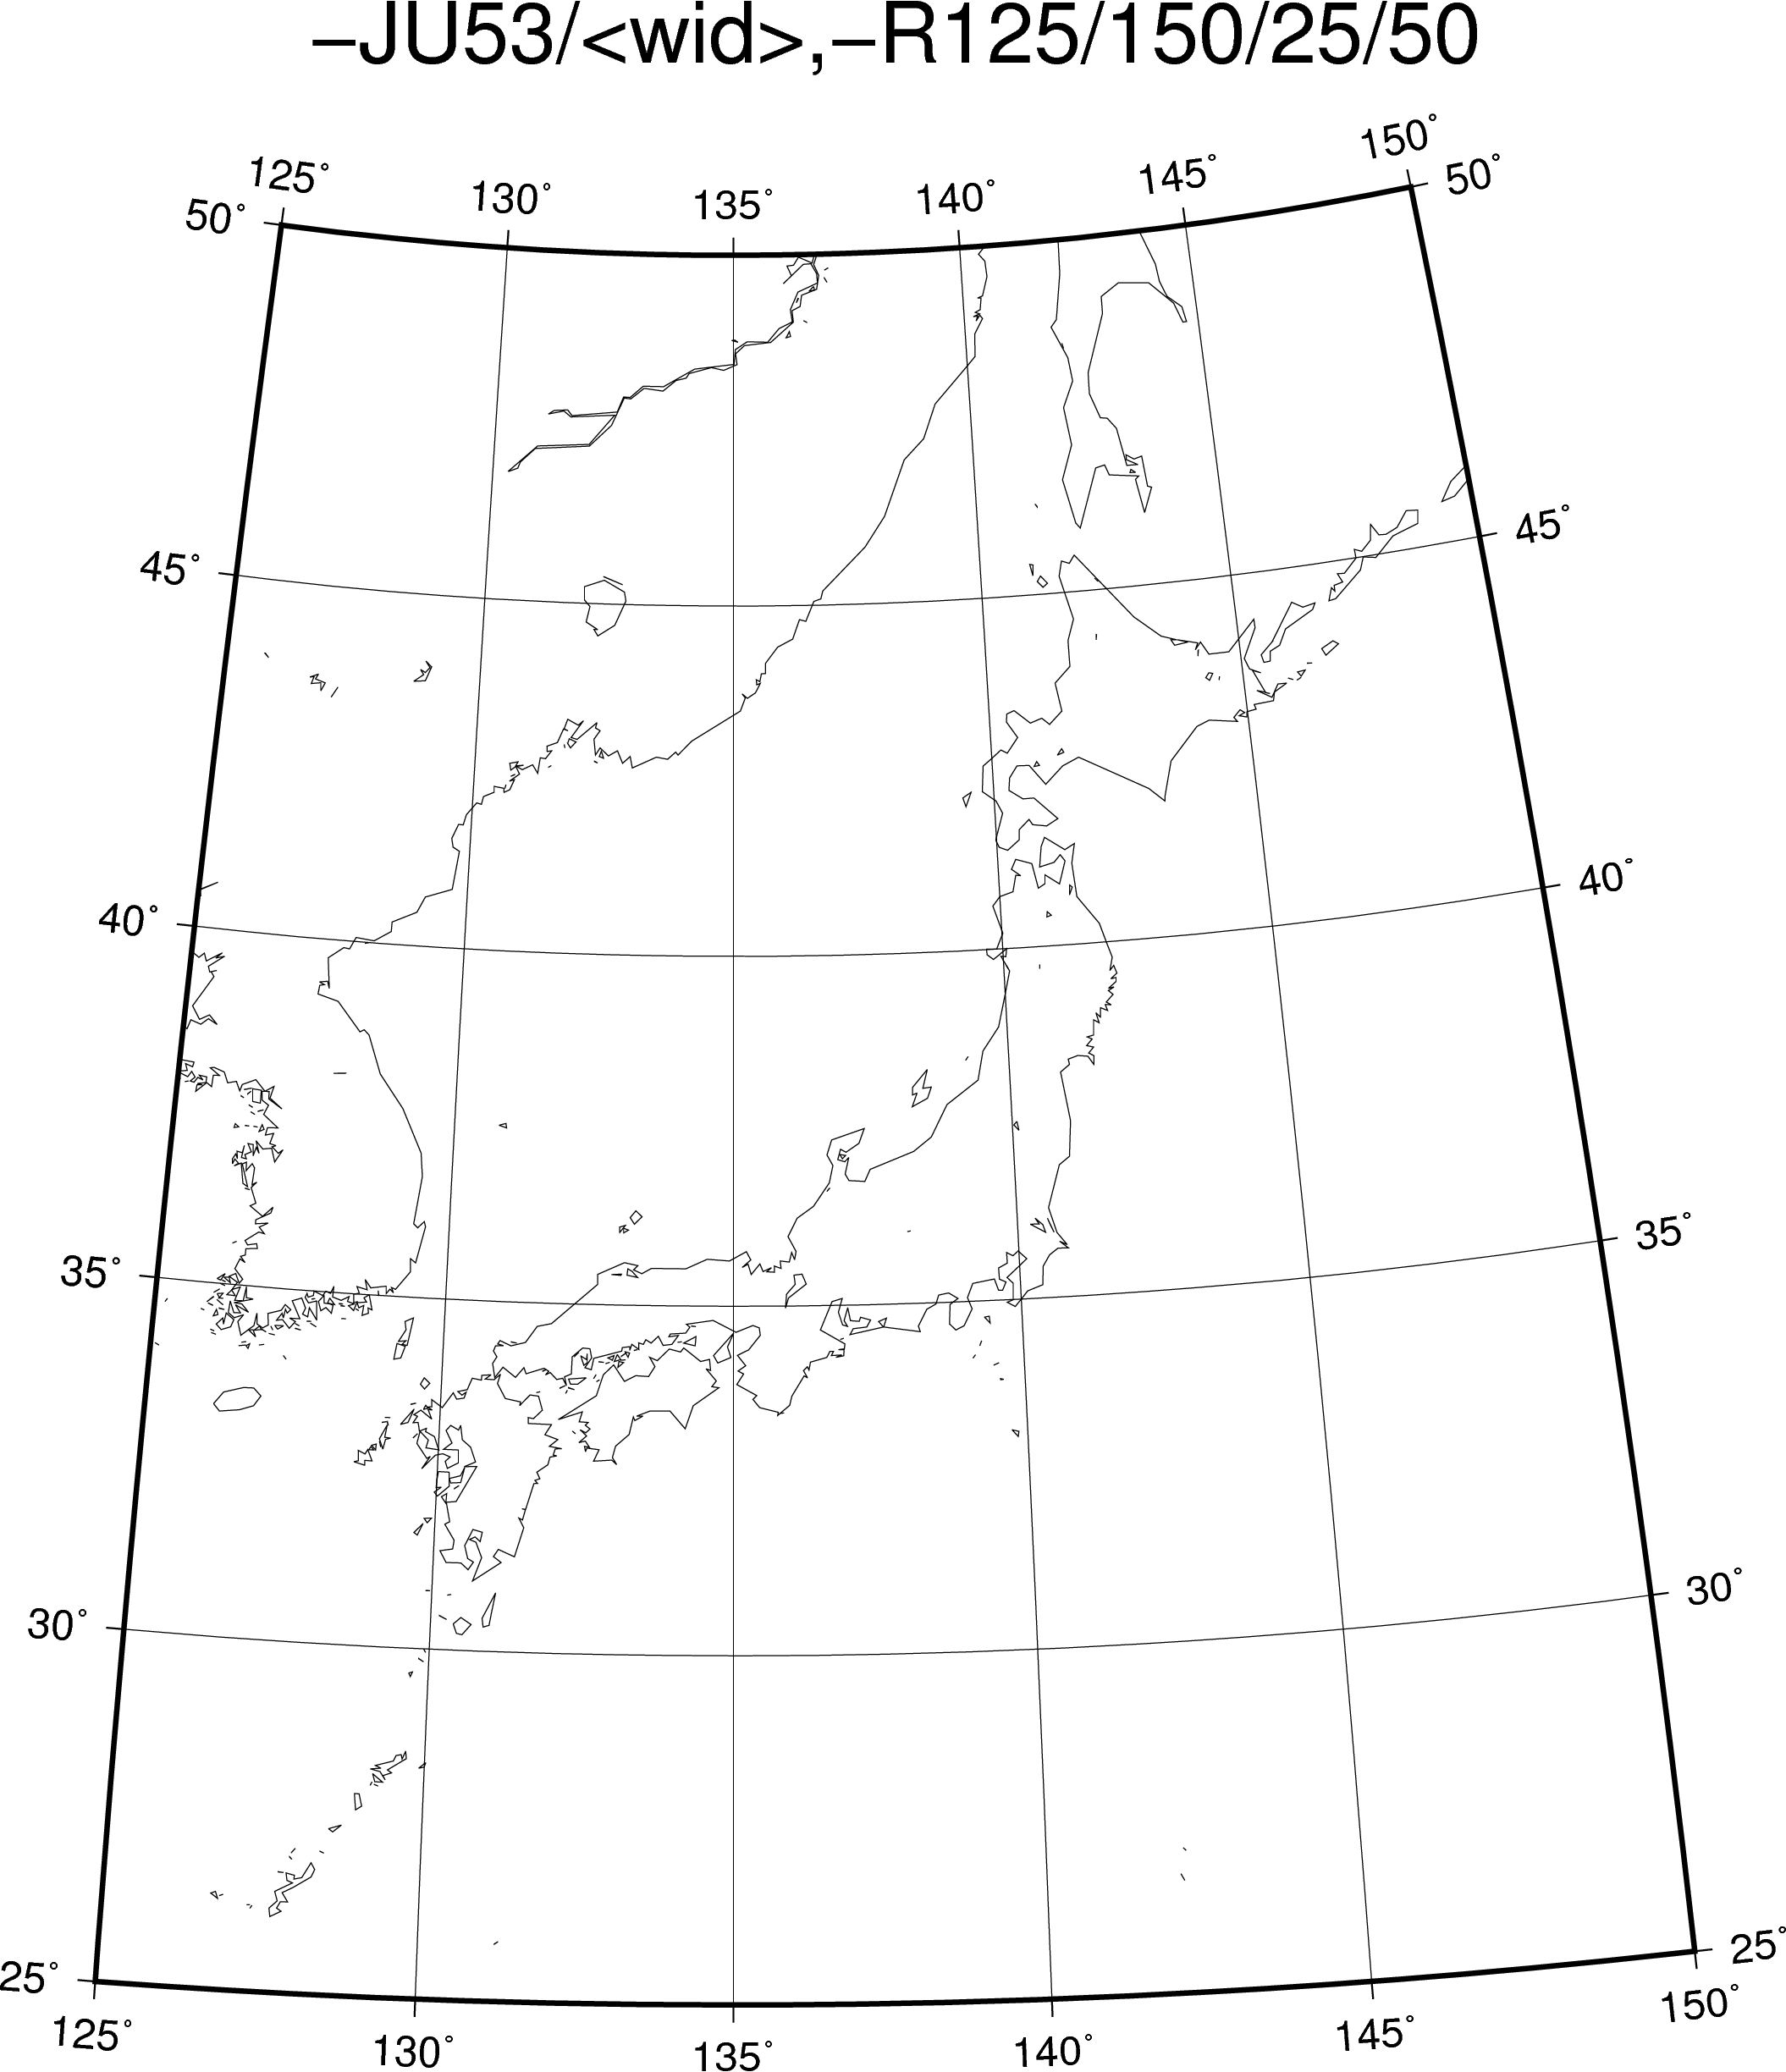
数値計算でよく UTM 座標を用いるため.計算結果に対して -JU で描くと変な隙間が出にくい.
- -JU<zone>/<width>
ここで,<zone> は UTM のゾーン(1〜60の整数).
# output file
output="JU"
# options
proj=U53/10
region=125/150/25/50
axes="-Ba5f5g5 -B+t-JU<utmzone>/<wid>,-R125/150/25/50"

# gmt6
gmt begin $output png
    gmt coast -J$proj -R$region $axes -W
gmt end

# gmt5
gmt pscoast -J$proj -R$region $axes -W -P > "${output}_gmt5.ps"
gmt psconvert -Tg -A "${output}_gmt5.ps"
-JC, Cylindrical projection, 円筒図法 †
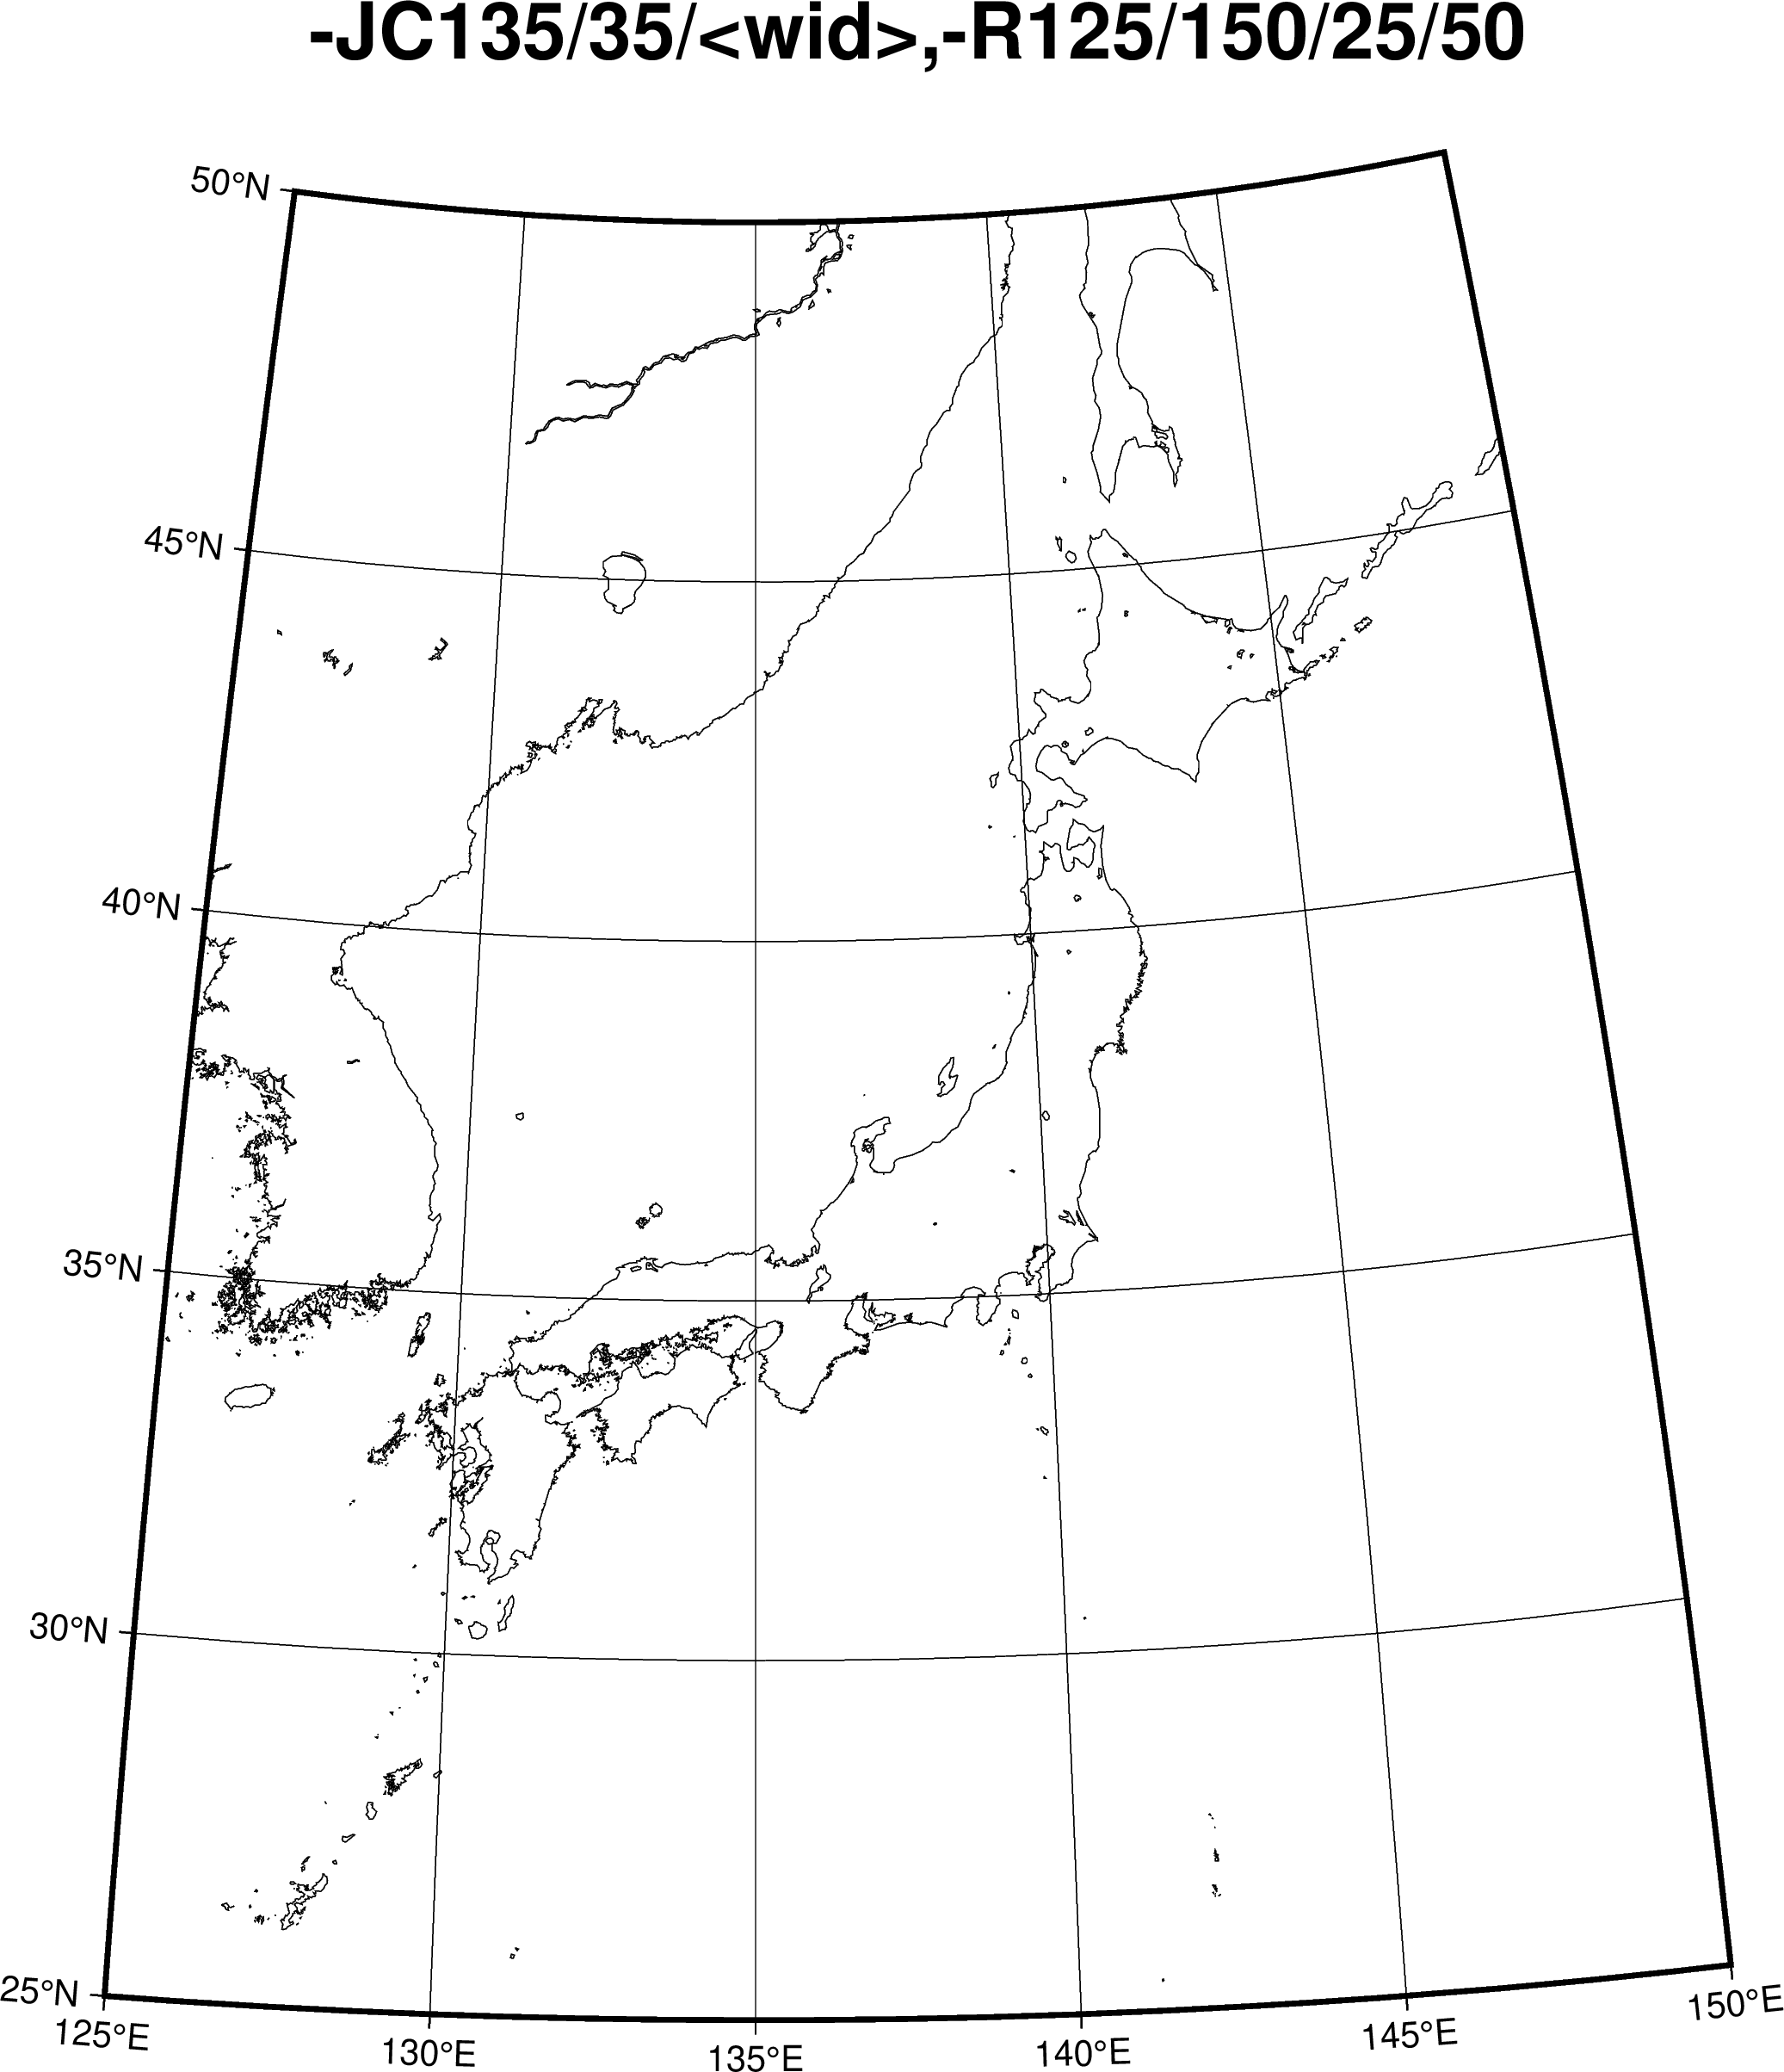
UTM に似ている.UTM でいう zone の基準点がないので,<lon0>,<lat0> で指定する.
- -JC<lon0>/<lat0>/<width>
# output file
output="JC"

# options
proj=C135/35/10
region=125/150/25/50
axes="-Ba5f5g5 -B+t-JC135/35/<wid>,-R125/150/25/50"

# gmt6
gmt begin $output png
    gmt coast -J$proj -R$region $axes -W
gmt end

# gmt5
gmt pscoast -J$proj -R$region $axes -W -P > "${output}_gmt5.ps"
gmt psconvert -Tg -A "${output}_gmt5.ps"
-JA, Lambert Azimuthal projection, ランベルト正積方位図法 †
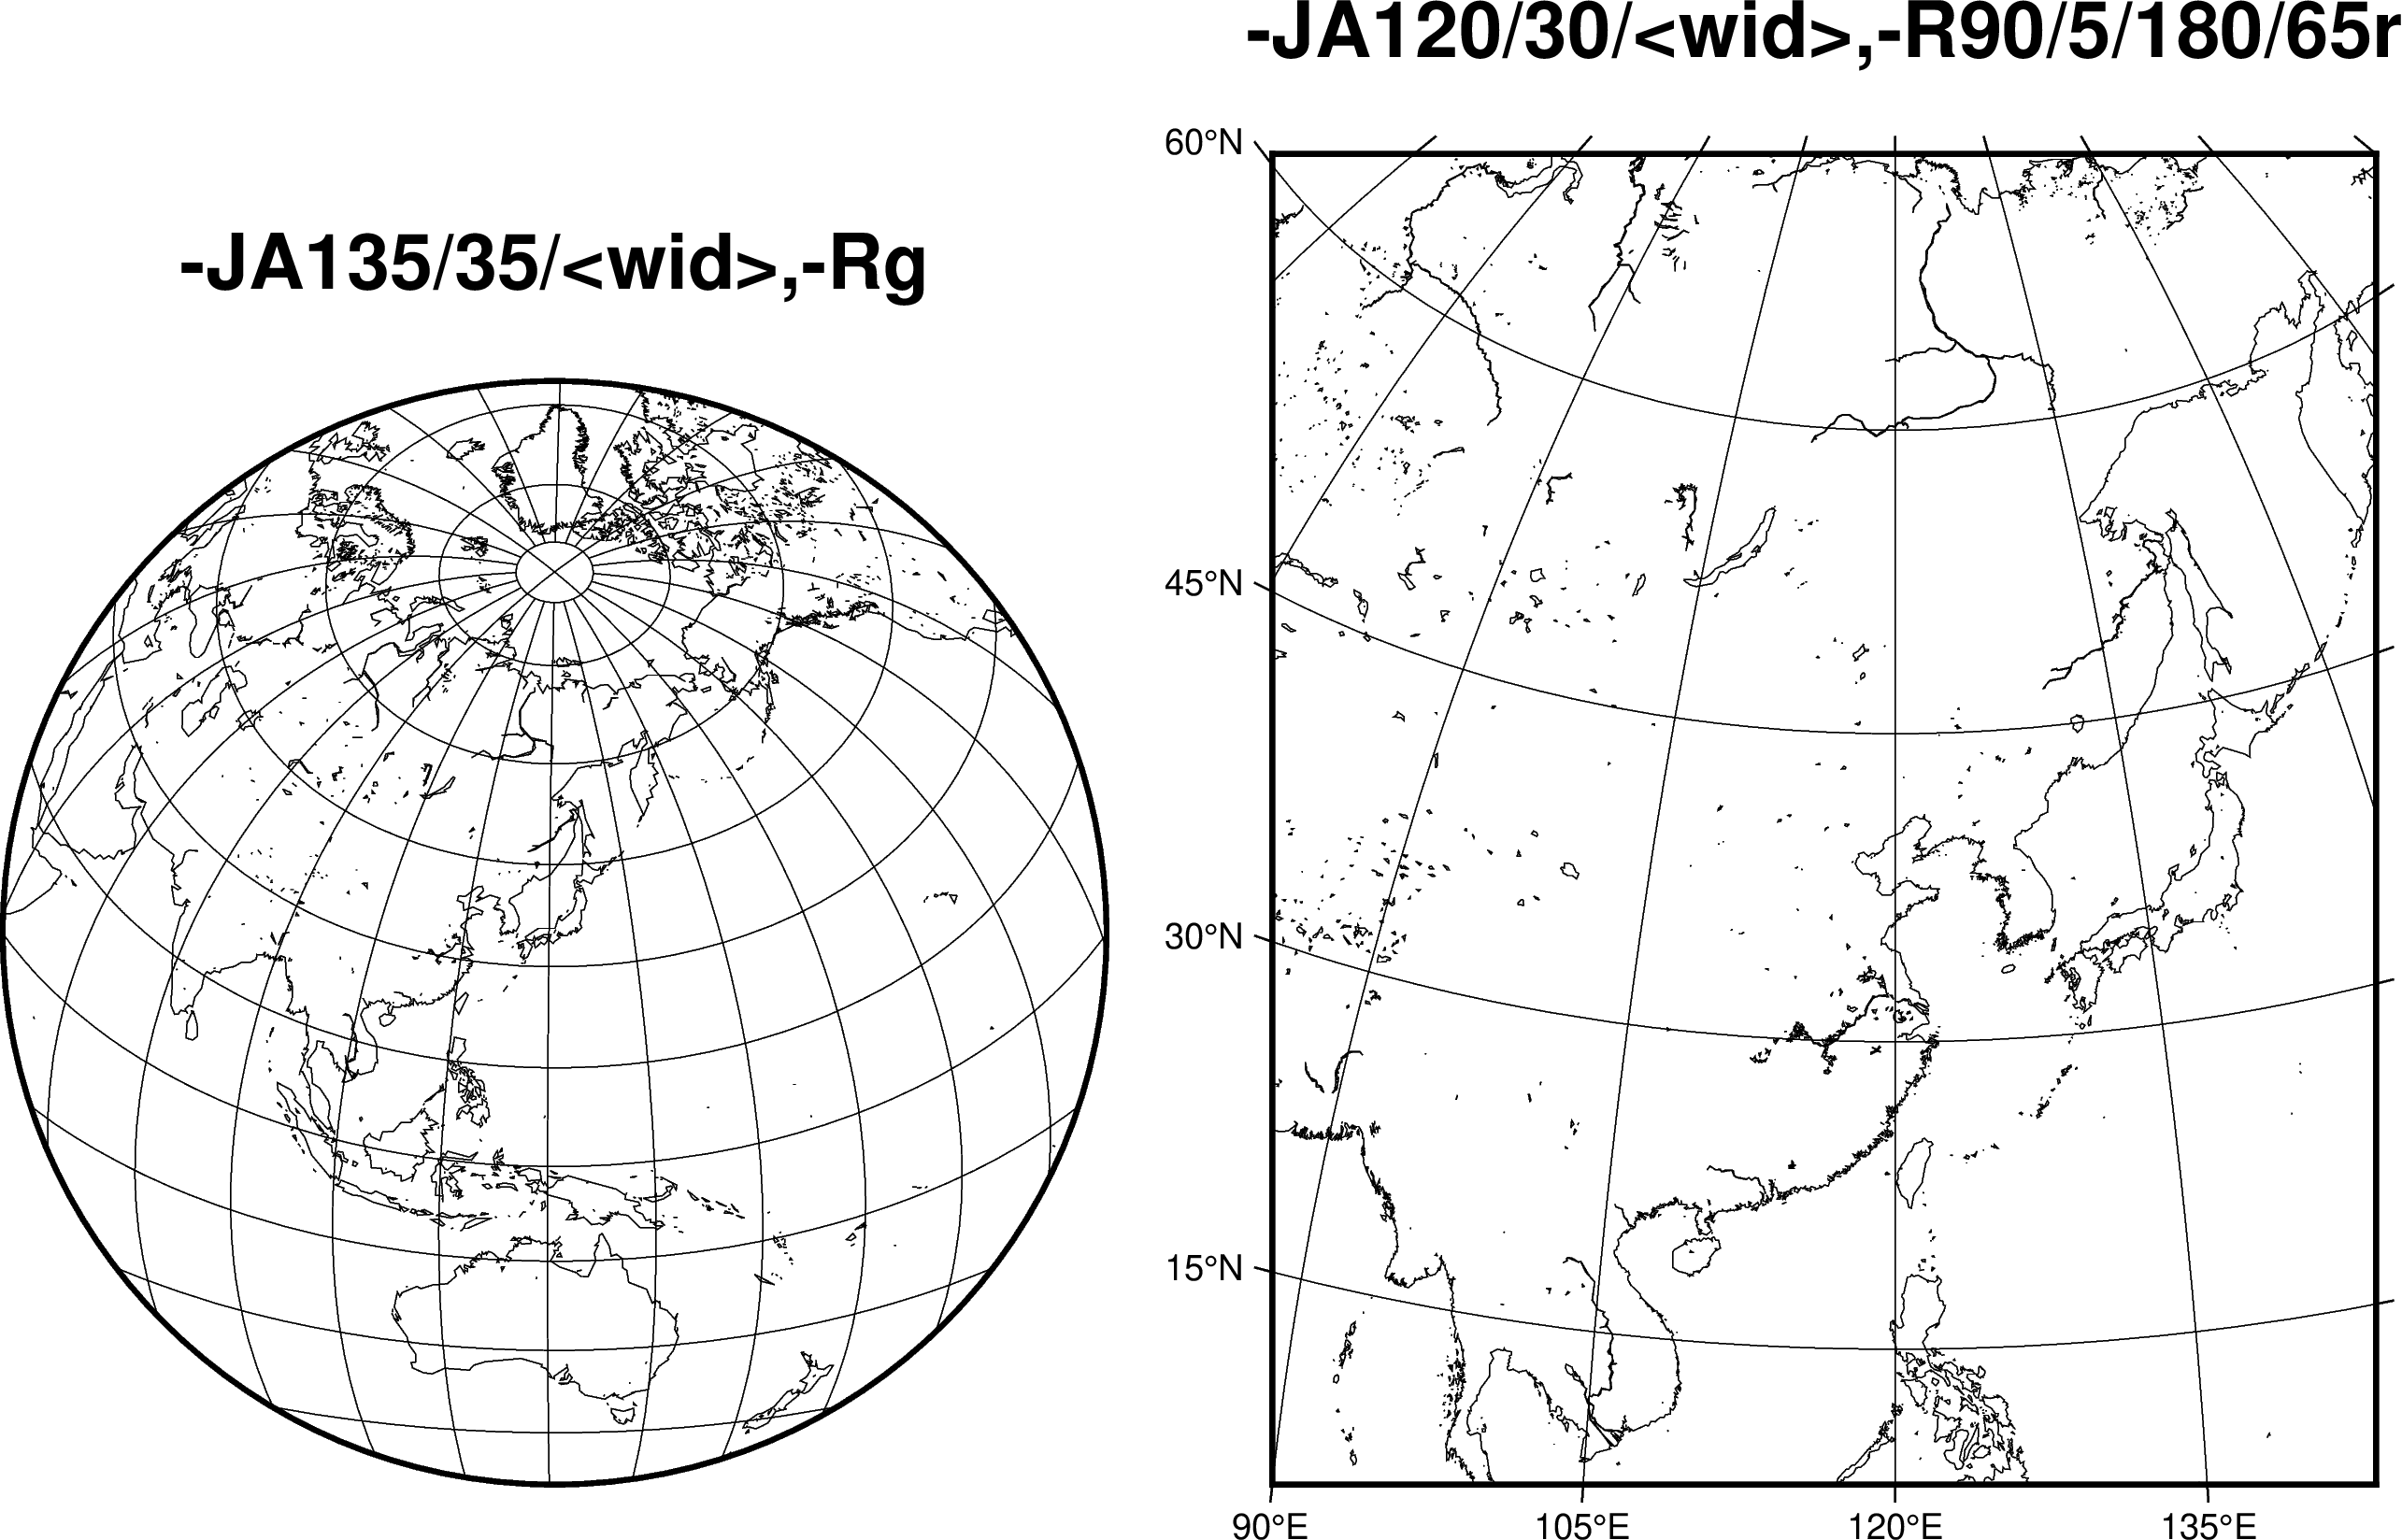
ランベルト図法.図の特性上,描ける最大範囲は半球.
オプション -R の標記が上記のタイプの指定方法と異なるので注意.
- -JA<lon0>/<lat0>/<width> -Rg
- -JA<lon0>/<lat0>/<width> -R<lonSW>/<latSW>/<lonNE>/<latNE>r
Rgは<lon0>,<lat0> を中心とする半球を描く.
"-R<...>r" は南西,北東の端を指定する.最後の【r】をつけ忘れないように…
g も r も付けず,R<lonmin>/<lonmax>/<latmin>/<latmax> のようにメルカトルなどと同様に設定した場合は無視され,全てRgとして扱われる.
# output file
output="JARgARr"

# options
proj1=A136/35/10
region1=g
axes1="-Ba15f15g15 -B+t-JA135/35/<wid>,-Rg"

# options
proj2=A120/30/10
region2=90/5/180/65r
axes2="-Ba15f15g15 -B+t-JA120/30/<wid>,-R90/5/180/65r"

# gmt6
gmt begin $output png
    gmt coast -J$proj1 -R$region1 $axes1 -W
    gmt coast -J$proj2 -R$region2 $axes2 -W -X11.5
gmt end
-JG, Azimuthal orthographic projection, 正射図法 †
地球表面を正射影して描かれる地図.オプションの表記方法は -JA に近い.
- -JG<lon0>/<lat0>/<width> -Rg
さらに詳細な指定もできるが,ここでは省略.
# output file
output="JG"
# options
proj=G135/35/10
region=g
axes="-Bf30g30 -B+t-JG135/35/<wid>,-Rg"

# gmt6
gmt begin $output png
    gmt coast -J$proj -R$region $axes -W
gmt end

# gmt5
gmt pscoast -J$proj -R$region $axes -W -P > "${output}_gmt5.ps"
gmt psconvert -Tg -A "${output}_gmt5.ps"
-JX, Non-geographical projection (linear) †
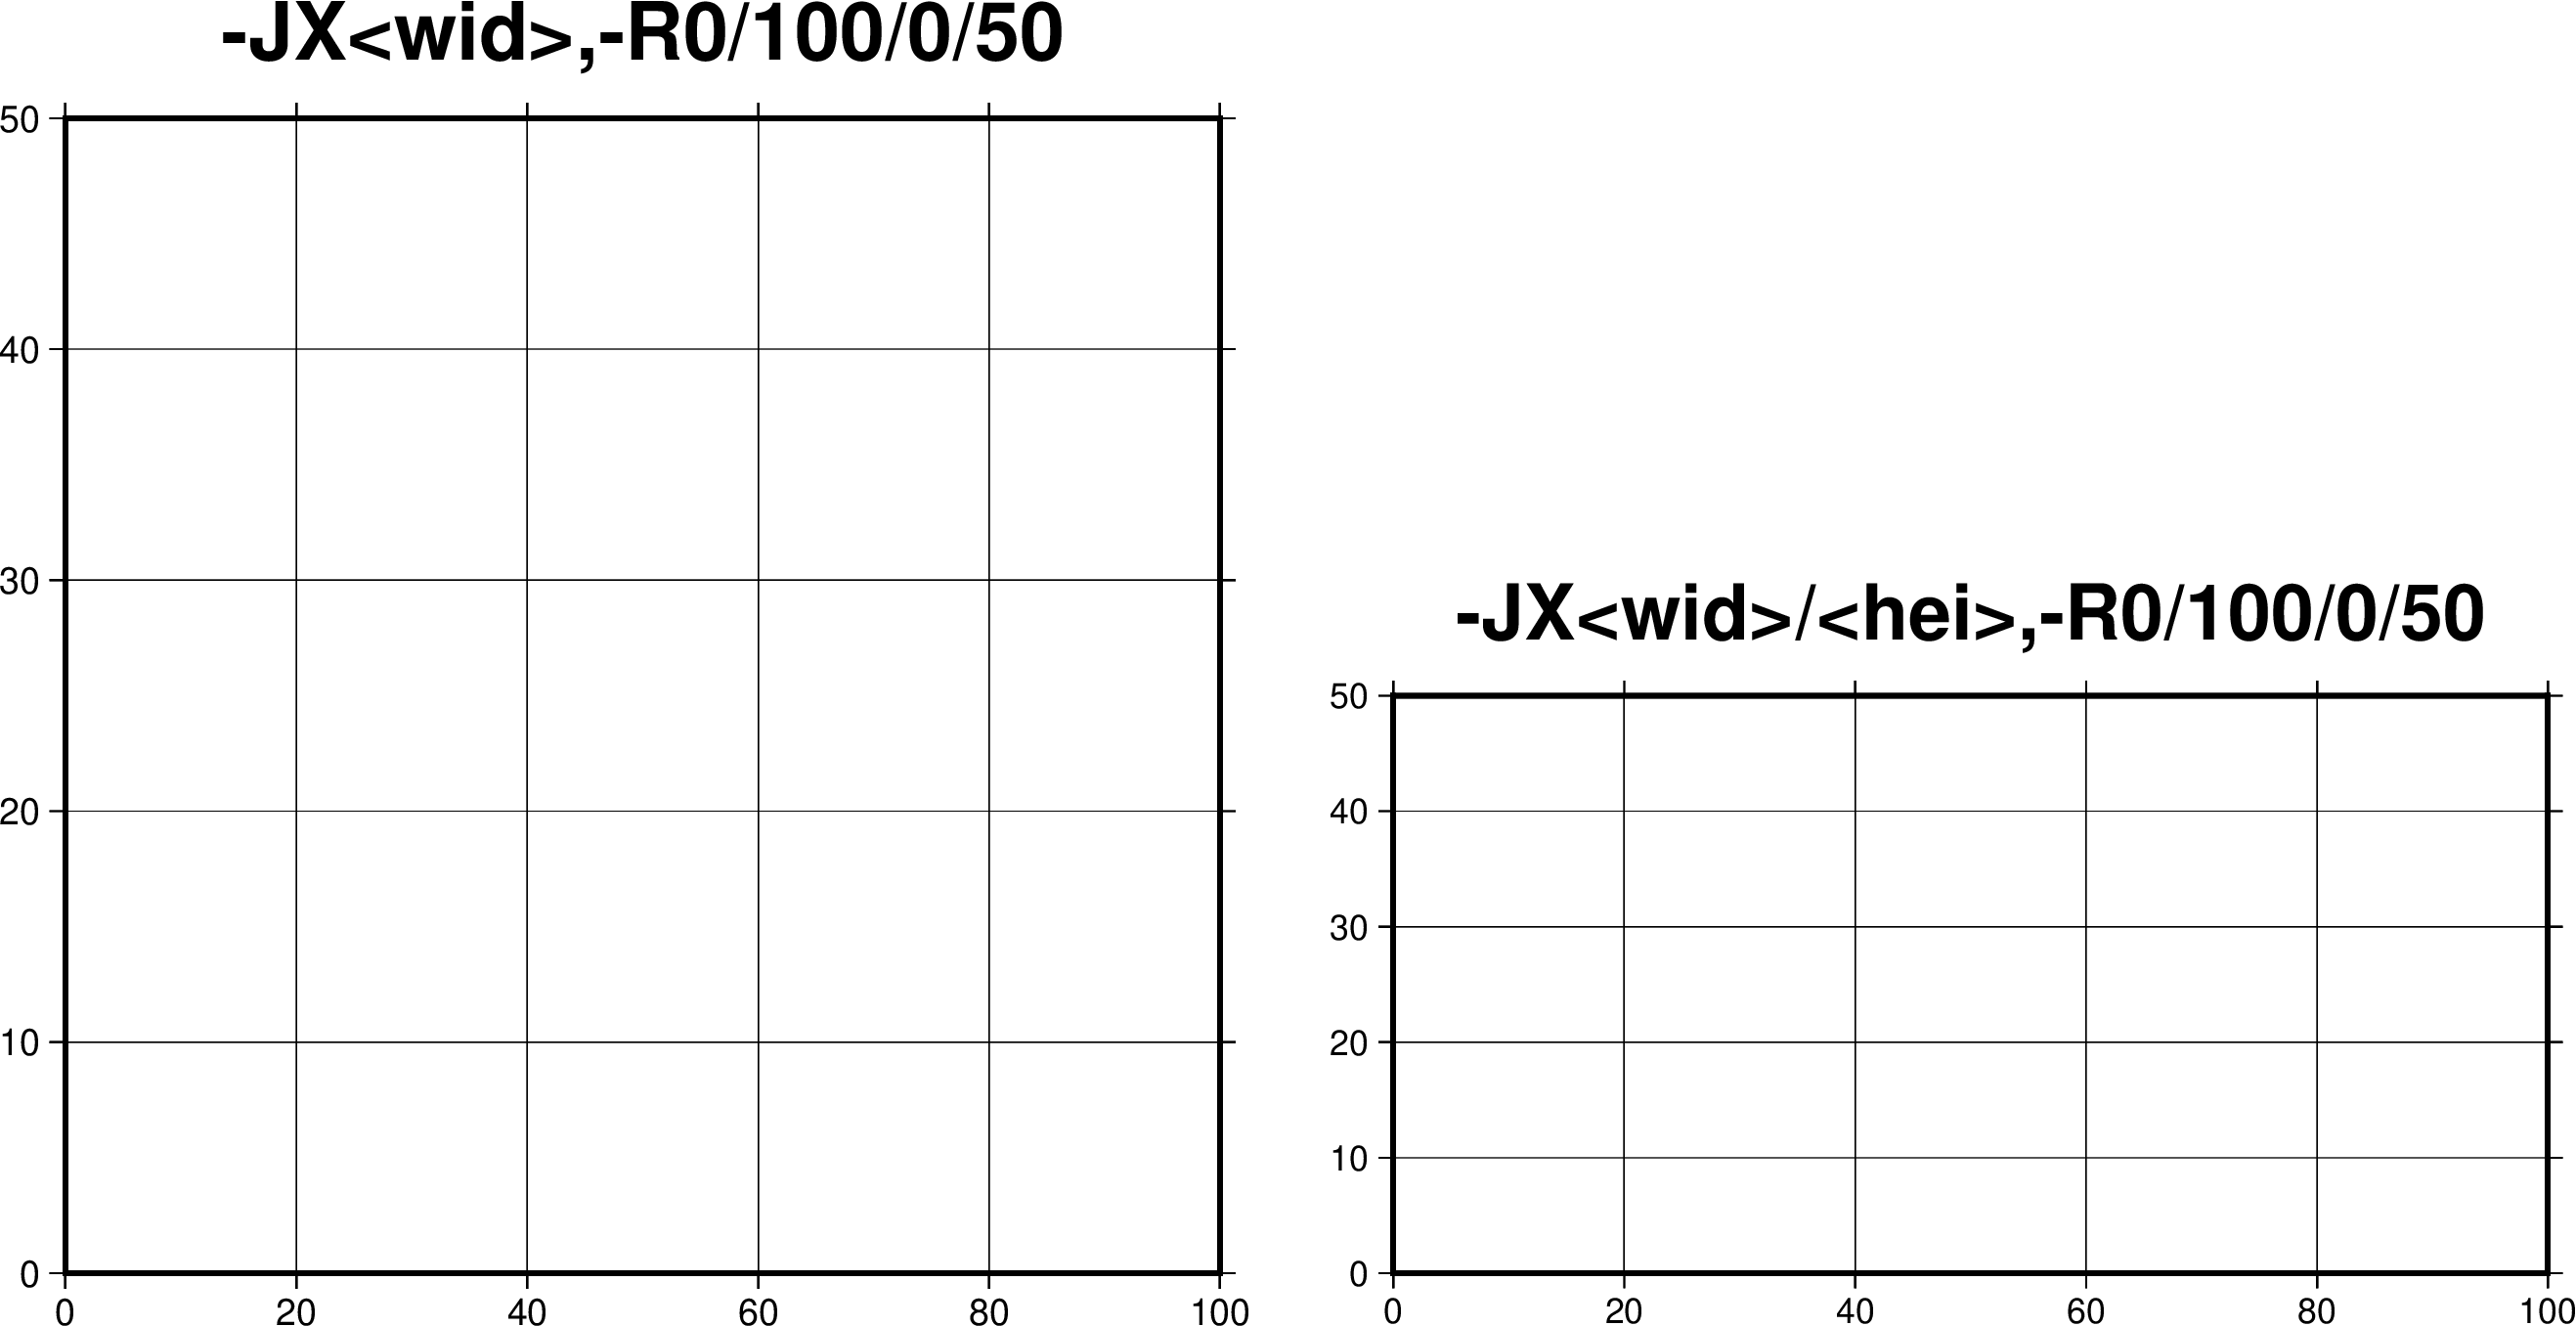
地図でない X-Y 座標には -JX を使う.
- -JX<width>
- -JX<width>/<height>
JX<width> の場合は,<height> は <width> と同じ値.
範囲指定 -R も基本的には -JM などの場合と同じ.
# output file
output="JXwXwh"

# options
proj1=X10
region1=0/100/0/50
axes1="-Bxa20g20 -By10g10 -BSWne+t-JX<wid>,-R0/100/0/50"

# options
proj2=X10/5
region2=0/100/0/50
axes2="-Bxa20g20 -By10g10 -BSWne+t-JX<wid>/<hei>,-R0/100/0/50"

# gmt6
gmt begin $output png
    gmt basemap -J$proj1 -R$region1 $axes1
    gmt basemap -J$proj2 -R$region2 $axes2 -X11.5
gmt end
-JXl, Non-geographical projection (log-log, semilog), 両対数,片対数図 †
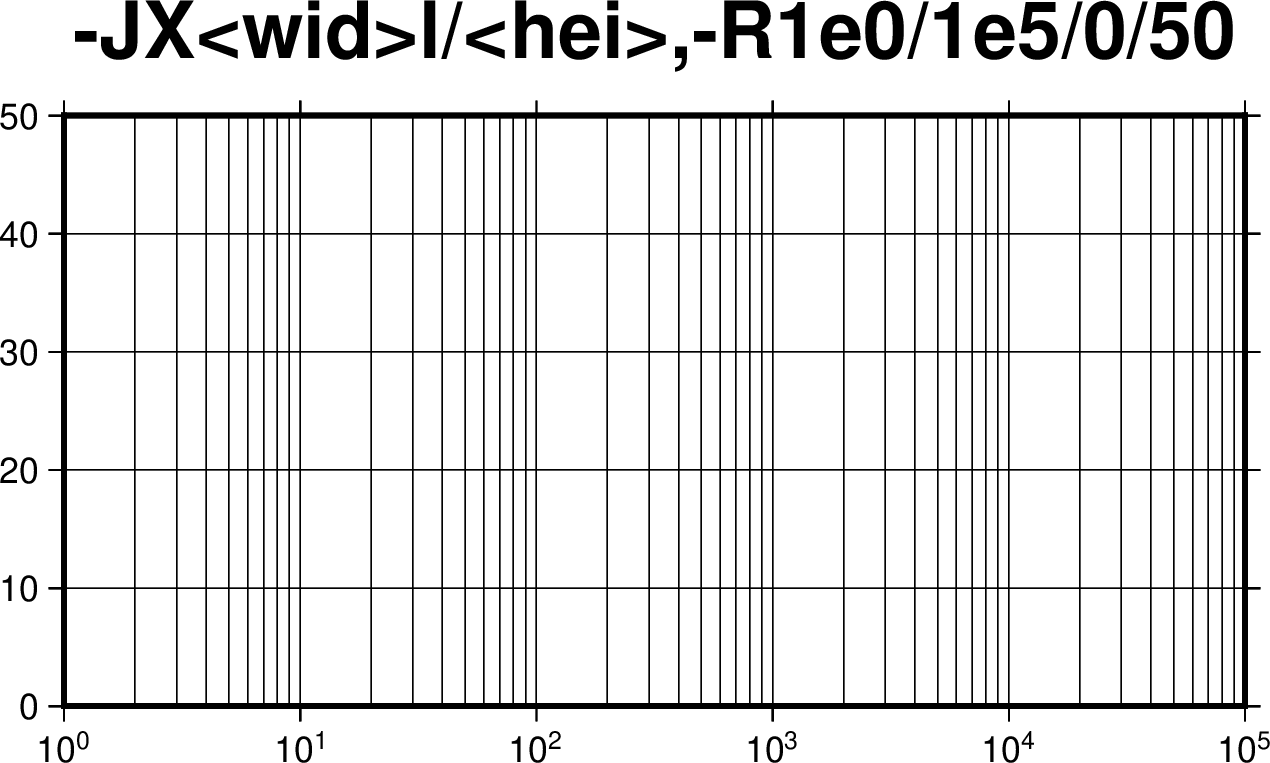
対数軸にしたい場合は,横軸なら <width> の後に,縦軸なら <height> の後にlを付す.
- -JX<width>l/<height> : 片対数 X
- -JX<width>/<height>l : 片対数 Y
- -JX<width>l/<height>l : 両対数
ここでは B オプションに記述する数値の意味が他と異なる点に注意.
a, f, g の値が大きいほど間隔が短くなる.p をつけることで 10^n 表記になる.
# output file
output="JXl"
# options
proj=X10l/5
region=1e0/1e5/0/50
axes="-Bxa1pg3p -By10g10 -BSWne+t-JX<wid>l/<hei>,-R1e0/1e5/0/50"

# gmt6
gmt begin $output png
    gmt basemap -J$proj -R$region $axes
gmt end

# gmt5
gmt psbasemap -J$proj -R$region $axes -P > "${output}_gmt5.ps"
gmt psconvert -Tg -A "${output}_gmt5.ps"
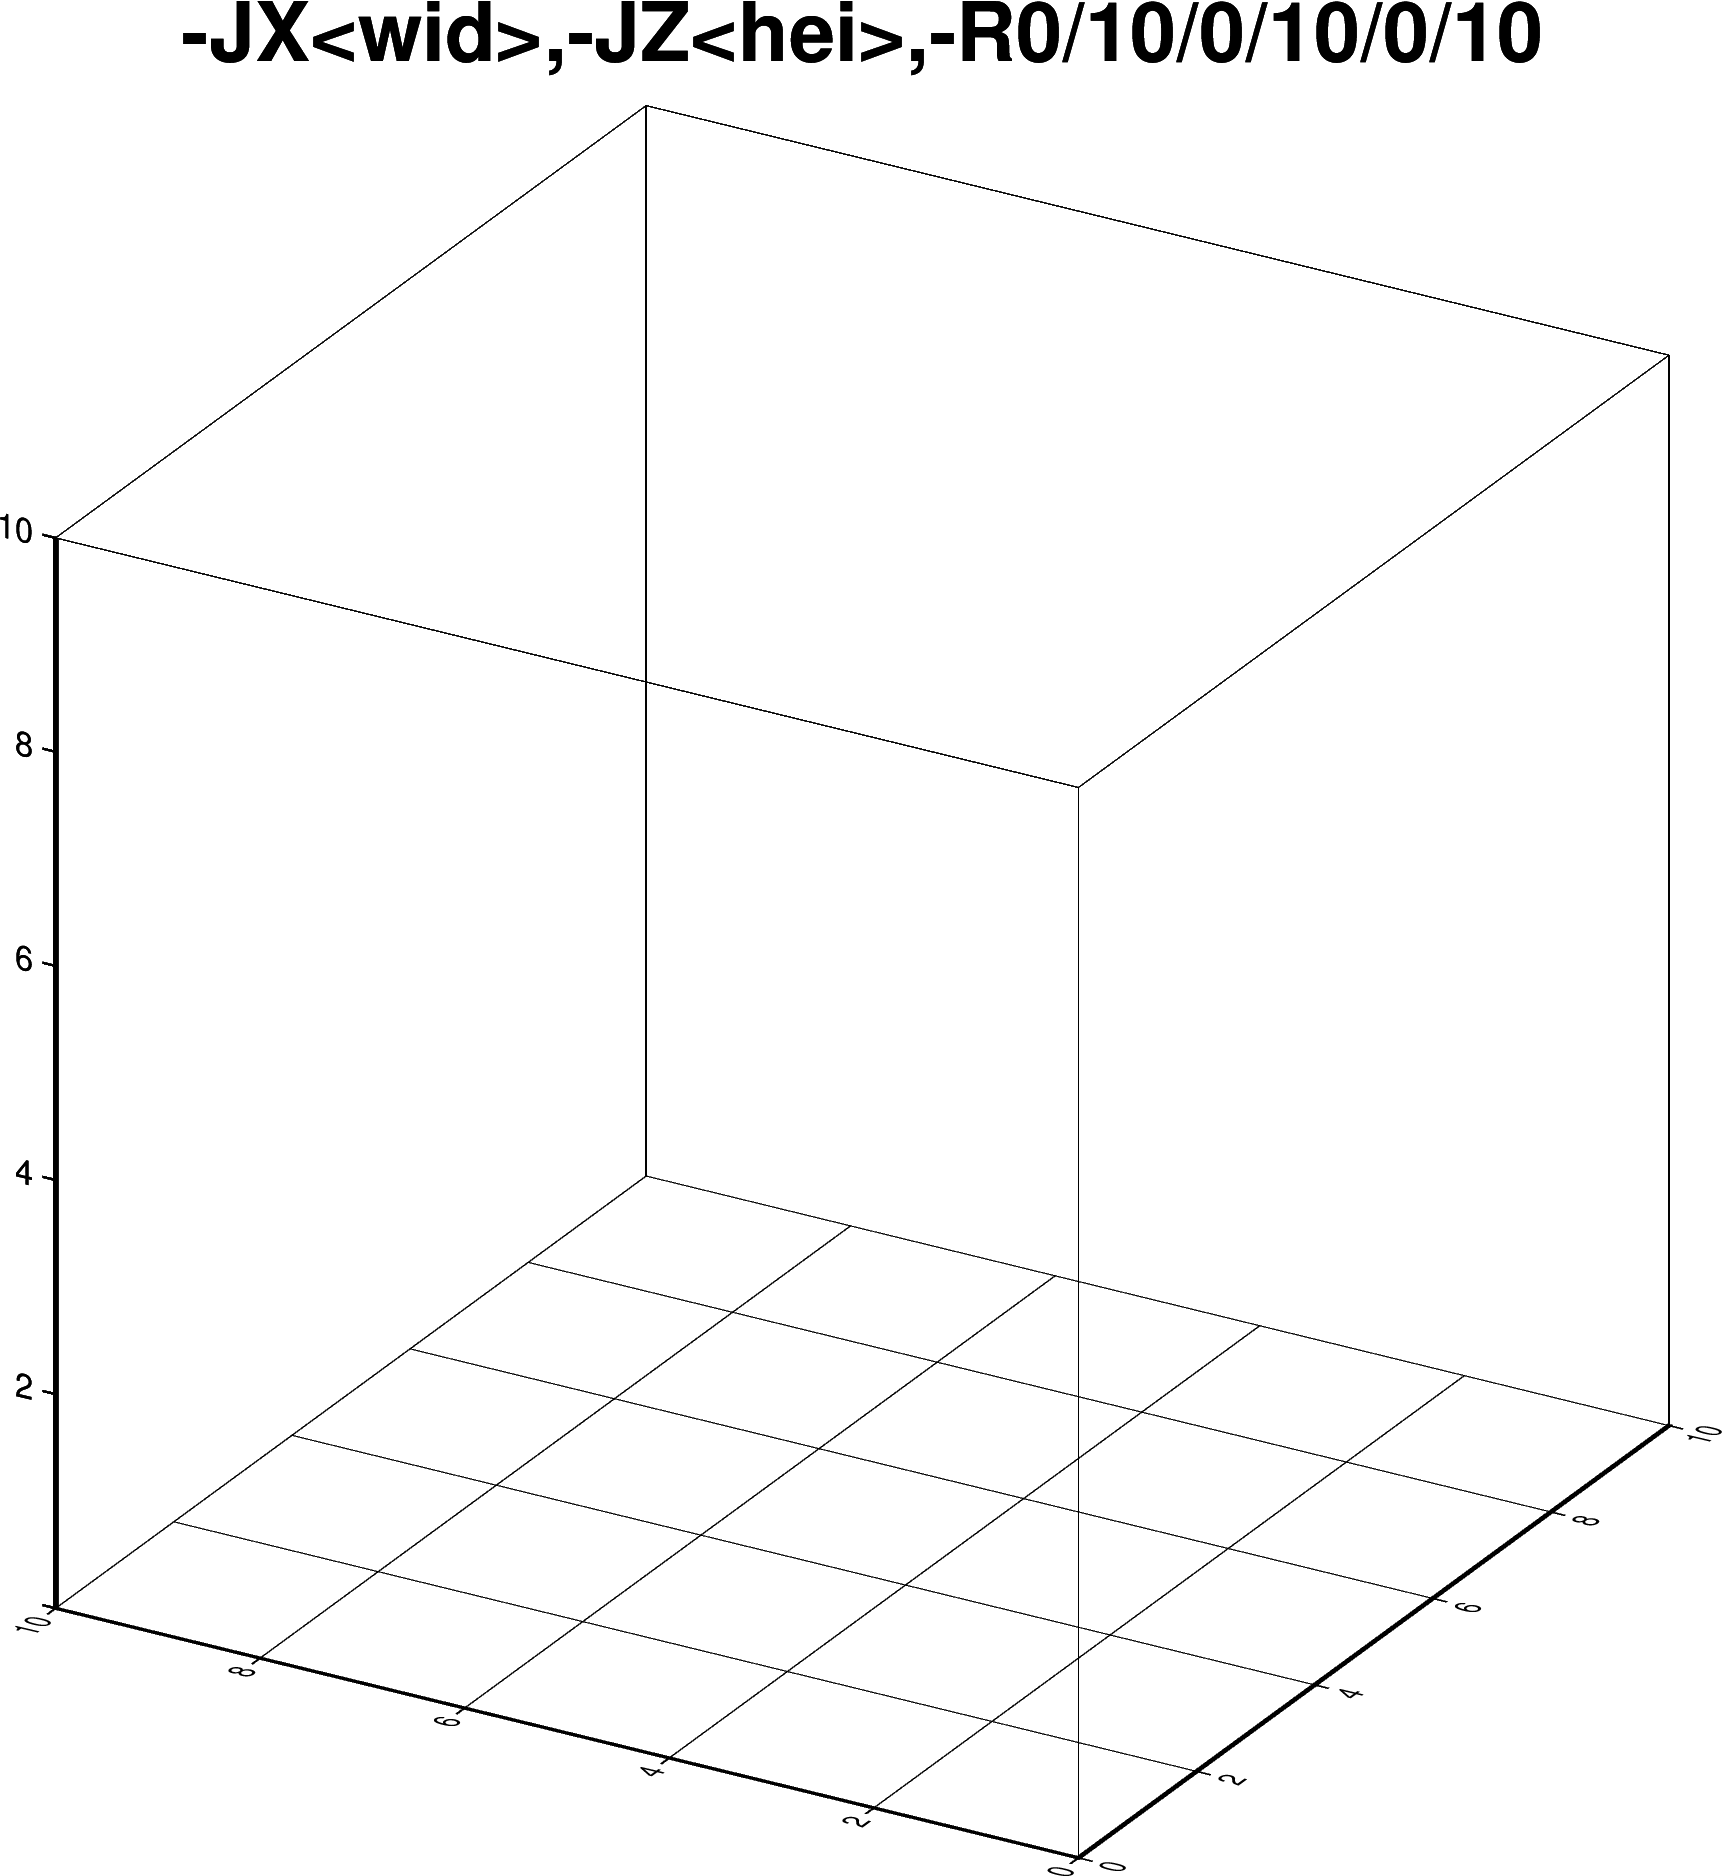
-JX,-JZ, Non-geographical projection (3-dimensional) †
3D図は,-JX と -JZ で2回 J オプションを使う.
- -JX<width> -JZ<height>
- -JX<width>/<length> -JZ<height>
ここで,<length> は水平平面で <width> と垂直な方向の長さ.
回転すると入力した素直な(?)長さにならないので,最終的に出力される幅,高さは角度から幾何的に計算する必要がある.
# output file
output="JXJZ.ps"
# output file
output="JXJZ"
# options
proj=X10
projZ=Z10
pers=-120/25
region=0/10/0/10/0/10
axes="-Bxa2g2 -Bya2g2 -Bza2f2 -BSWZ+b+t-JX<wid>,-JZ<hei>,-R0/10/0/10/0/10"


# gmt6
gmt begin $output png
    gmt basemap -J$proj -R$region $axes -J$projZ -p$pers
gmt end

# gmt5
gmt psbasemap -J$proj -R$region $axes -P -J$projZ -p$pers > "${output}_gmt5.ps"
gmt psconvert -Tg -A "${output}_gmt5.ps"
-JX, -Rd or -Rg, 地球全体図 †
メルカトル図法 -JM では,R オプションで極の -90,90 を含めることはできず,エラーになる.
JX の projection で,地球全体を描く方法がある.-Rg または -Rd とすることで,地球全体を描くことができる.
- -JX<width> -Rd
- -JX<width> -Rd<lonmin>/<lonmax>/<latmin>/<latmax>
- -JX<width> -Rg
- -JX<width> -Rg<lonmin>/<lonmax>/<latmin>/<latmax>
経度方向の中心は,Rd で本初子午線,Rg で日付変更線になる.
それ以外の経度を中心にしたい場合は -R で中心に来るように <lonmin>/<lonmax> を設定する.
# output file
# output file
output="JXRd_JXRg"

# options
proj1=X10/5
region1=d
axes1="-Bxa60f60g60 -Bya30f30g30 -B+t-JX<wid>/<hei>,-Rd"

# options
proj2=X10/5
region2=g-45/315/-90/90
axes2="-Bxa60f60g60 -Bya30f30g30 -B+t-JX<wid>/<hei>,-Rg-45/315/-90/90"

# gmt6
gmt begin $output png
    gmt coast -J$proj1 -R$region1 $axes1 -W
    gmt coast -J$proj2 -R$region2 $axes2 -W -X11.5
gmt end
-JKf, -JKs, Eckert projection, エケルト図法 †
- -JKf<lon0>/<width> :エケルト第4図法
- -JKs<lon0>/<width> :エケルト第6図法
lon0 は経度方向の中心である.緯度の annotations を入れる場合は,緯度 -90 と 90 のラベルが埋もれるので,表示されないように範囲を調整する.
# output file
output="JKf_JKs"

# options
proj1=Kf180/10
region1=d0/360/-89/89
axes1="-Bxa60f60g60 -Bya30f30g30 -B+t-JKf180/<wid>,-Rd0/360/-89/89"

# options
proj2=Ks180/10
region2=d0/360/-89/89
axes2="-Bxa60f60g60 -Bya30f30g30 -B+t-JKs180/<wid>,-Rd0/360/-89/89"

# gmt6
gmt begin $output png
    gmt coast -J$proj1 -R$region1 $axes1 -W
    gmt coast -J$proj2 -R$region2 $axes2 -W -X11.5
gmt end
